
Scenario: Why SLA Monitoring Matters
You’re managing IT with limited resources. One night, a key service goes down, and you only hear about it the next morning from an angry user. Now you’re chasing logs, explaining delays, and scrambling to meet audit requirements. What if you had a simple monitor that alerted you the moment something failed and kept a full uptime history for the year?
That’s not just monitoring—it’s SLA peace of mind.
- Catch issues early.
- Prove compliance.
- Stay in control.
As an IT professional managing a private network, I found Uptime Kuma, an open-source monitoring tool, to be a game-changer. In this step-by-step guide, I’ll share how I deployed Uptime Kuma on an Ubuntu server using Docker, secured it with SSL for local access, set up monitors for compute, network, and firewall devices, and configured Microsoft Teams notifications for up/down alerts.
This setup is tailored for an internal network (192.168.1.0/24, no public internet exposure) and includes tips for stable monitoring. Whether you’re an IT admin or hobbyist, let’s get your monitoring solution up and running!
| What to Monitor | Why it Matters |
|---|---|
| Servers | Essential for application availability and performance. |
| Hypervisors | Ensures virtual environments remain operational. |
| Virtual Machines | Critical for service continuity and resource efficiency. |
| Network Switches | Maintains network availability and prevents downtime. |
| Firewalls | Protects network integrity; downtime impacts security posture. |
| HTTP/HTTPS Websites and Apps | Ensures public-facing services remain accessible. |
| TCP Ports | Immediate detection of critical port failures. |
| SSL Certificates | Prevents unexpected expirations and security issues. |
| MySQL Databases | Database availability directly impacts multiple applications. |
Why Uptime Kuma?
Uptime Kuma is a free open-source self-hosted alternative to tools like Pingdom or StatusCake, offering:
- Ping, HTTP, and TCP monitoring for servers, switches, and firewalls.
- SLA tracking with detailed uptime reports.
- Customizable notifications (e.g., MS Teams, Email, Discord).
- Docker support for easy deployment.
- Open-source with an active community (
https://github.com/louislam/uptime-kuma).
For my internal network (192.168.1.0/24) no public IP, Uptime Kuma was ideal for monitoring critical infrastructure without exposing it to the internet.
Prerequisites
Before starting, ensure you have:
- Ubuntu Server (e.g., 20.04 or 22.04) with root/sudo access.
- Docker and Docker Compose installed.
- SSL Certificate: A wildcard certificate (e.g.,
*.yourdomain.com) for HTTPS. I used a self-signed certificate for my internal network. - Microsoft Teams Webhook: For notifications (I’ll show you how to set this up).
- Internal Network: Devices to monitor (e.g., servers, switches, firewalls) on your network.
- Domain or Hosts File: A local DNS entry (e.g.,
monitor.yourdomain.com) or hosts file mapping to192.168.1.100.
Step 1: Install Docker and Docker Compose
First, set up Docker on your Ubuntu server.
# Update packages
sudo apt update
sudo apt upgrade -y

# Install Docker
sudo apt install docker.io -y
sudo systemctl enable docker
sudo systemctl start docker

# Install Docker Compose
sudo curl -L "https://github.com/docker/compose/releases/download/v2.20.2/docker-compose-$(uname -s)-$(uname -m)" -o /usr/local/bin/docker-compose
sudo chmod +x /usr/local/bin/docker-compose

# Verify installations
docker --version
docker-compose --version
Add your user to the Docker group to run commands without sudo:
sudo usermod -aG docker $USER
# Log out and back in for changes to take effect
Step 2: Set Up Uptime Kuma with Docker
Create a directory for Uptime Kuma and configure it with Docker Compose.
mkdir ~/uptime-kuma
cd ~/uptime-kuma
nano docker-compose.yml
Add the following configuration:
version: 2
services:
  uptime-kuma:
    image: louislam/uptime-kuma:1.23.13
    container_name: uptime-kuma
    ports:
      - "3001:3001"
    volumes:
      - ./uptime-kuma-data:/app/data
    restart: always
    environment:
      - TZ=Asia/Dubai
Save and exit (Ctrl+O, Enter, Ctrl+X).
Start Uptime Kuma:
docker-compose up -d
Verify it’s running:
docker ps
Access Uptime Kuma at http://192.168.1.100:3001 (replace with your server’s IP). You should see the login page. Create an admin account to proceed.
Step 3: Secure Uptime Kuma with SSL Using Nginx
For secure internal access, I used Nginx as a reverse proxy with a wildcard SSL certificate.
Install Nginx
sudo apt install nginx -y
sudo systemctl enable nginx
sudo systemctl start nginx
Configure SSL Certificate
Place your wildcard certificate and key in /etc/nginx/certs:
sudo mkdir /etc/nginx/certs
sudo cp /path/to/monitor.fullchain.crt /etc/nginx/certs/
sudo cp /path/to/monitor.decrypted.key /etc/nginx/certs/
sudo chmod 600 /etc/nginx/certs/*
If you don’t have a certificate, create a self-signed one:
sudo openssl req -x509 -nodes -days 365 -newkey rsa:2048 \
  -keyout /etc/nginx/certs/monitor.decrypted.key \
  -out /etc/nginx/certs/monitor.fullchain.crt \
  -subj "/C=AE/ST=Dubai/L=Dubai/O=Buildingtheitguy/CN=*.yourdomain.com"
Configure Nginx
Create an Nginx configuration:
sudo nano /etc/nginx/sites-available/uptime-kuma
Add:
server {
    listen 80;
    server_name monitor.yourdomain.com 192.168.1.100;

    # Redirect HTTP to HTTPS
    return 301 https://$server_name$request_uri;
}

server {
    listen 443 ssl;
    server_name monitor.yourdomain.com 192.168.1.100;

    ssl_certificate /etc/nginx/certs/monitor.fullchain.crt;
    ssl_certificate_key /etc/nginx/certs/monitor.decrypted.key;

    location / {
        proxy_pass http://localhost:3001;
        proxy_set_header Host $host;
        proxy_set_header X-Real-IP $remote_addr;
        proxy_set_header X-Forwarded-For $proxy_add_x_forwarded_for;
        proxy_set_header X-Forwarded-Proto $scheme;
        proxy_set_header Accept-Encoding "";
    }
}
Enable the site:
sudo ln -s /etc/nginx/sites-available/uptime-kuma /etc/nginx/sites-enabled/
sudo nginx -t
sudo systemctl reload nginx
Configure Local DNS
Map monitor.yourdomain.com to 192.168.1.100 in your internal DNS or hosts file:
- On client devices (e.g., Windows): Open Notepad with Admin
C:\Windows\System32\drivers\etc\hosts- Add:
192.168.1.100 monitor.yourdomain.com
Access Uptime Kuma at https://monitor.yourdomain.com. Accept any self-signed certificate warnings.
Step 4: Configure Monitors
Uptime Kuma supports various monitor types. I set up ping and HTTPS monitors for my infrastructure.
- Add a Ping Monitor (e.g., Hypervisor, Firewall, Switch):
- Log in to
https://monitor.yourdomain.com. - Click “Add New Monitor” > Type: Ping.
- Settings:
- Hostname:
192.168.1.1(your switch’s IP). - Interval: 120 seconds.
- Timeout: 10 seconds.
- Retry: 2.
- Hostname:
- Save and test.
- Log in to
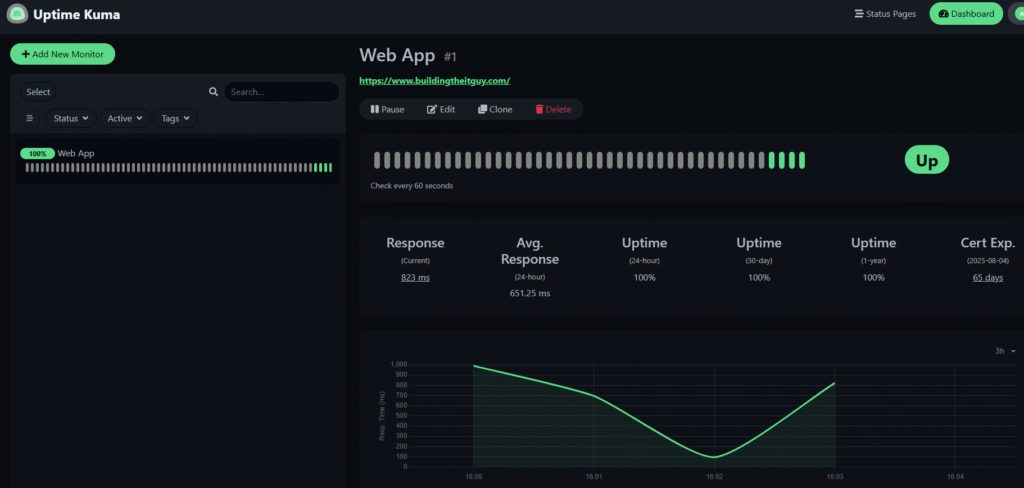
- View SLA Data:
- Go to Dashboard > Click a monitor > “History” or “Raw Data” to track uptime percentages.
- Data is stored in
~/uptime-kuma/uptime-kuma-data.
Tip: I noticed intermittent up/down status for a VM due to Uptime Kuma’s 56-byte ping packets (84 bytes total with headers) decreased to 32-byte and if you want you can increase the interval and retries helped, as did checking network MTU (1500) and VM performance.
Step 5: Set Up MS Teams Notifications
To receive up/down alerts in Microsoft Teams:
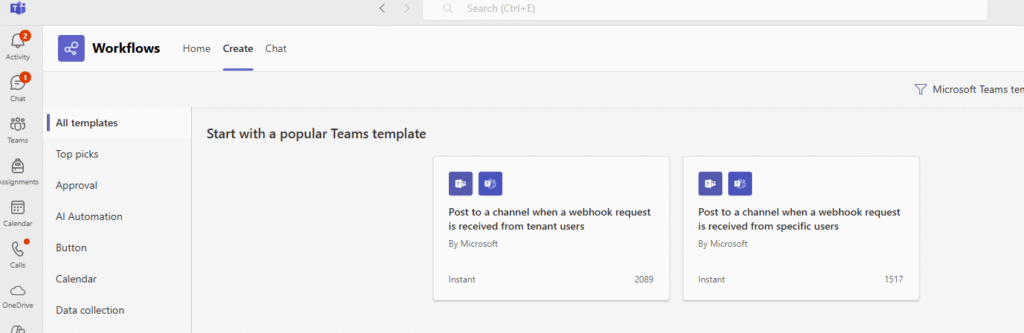
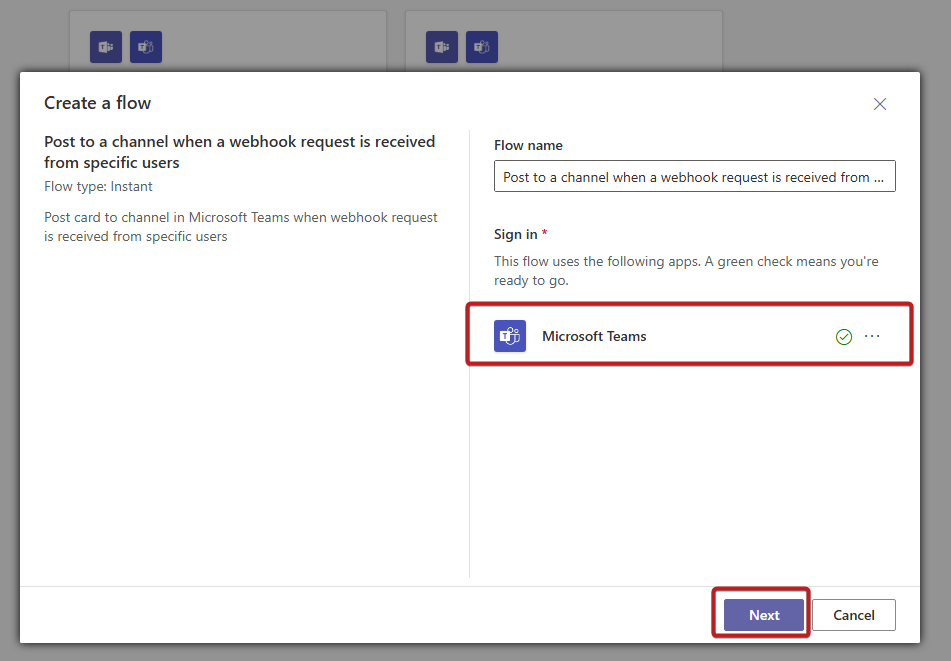
- Create a Webhook:
- In MS Teams, Add Workflows, and Click Create and search for template
- Post to a channel when a webhook request is received
- Name it (e.g., “Uptime Kuma Alerts”) and create.
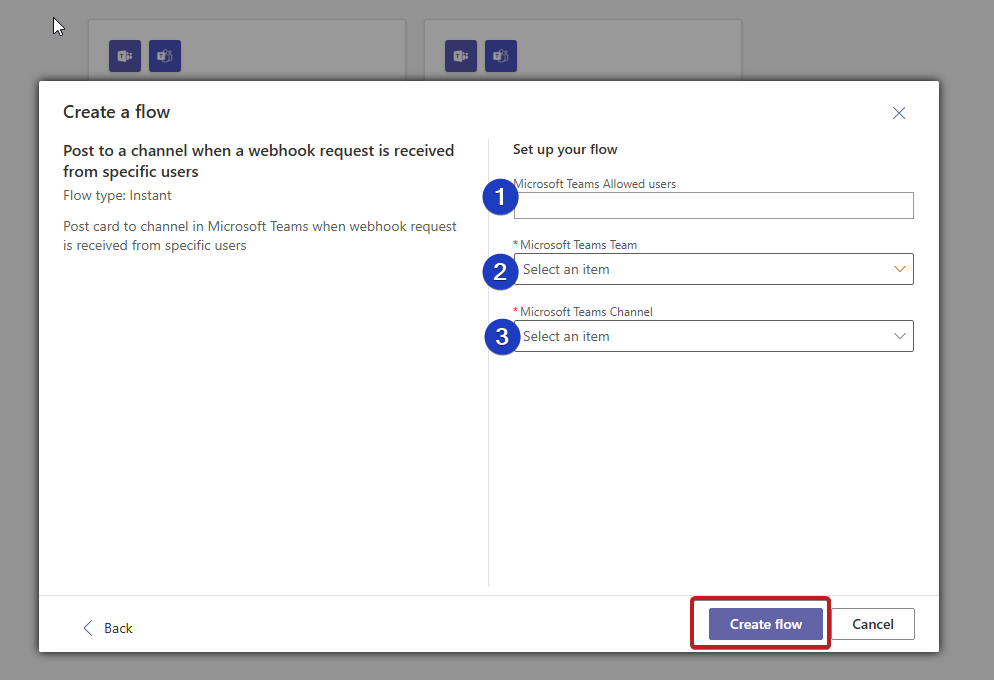
- Copy the webhook URL (e.g.,
https://outlook.office.com/webhook/...).
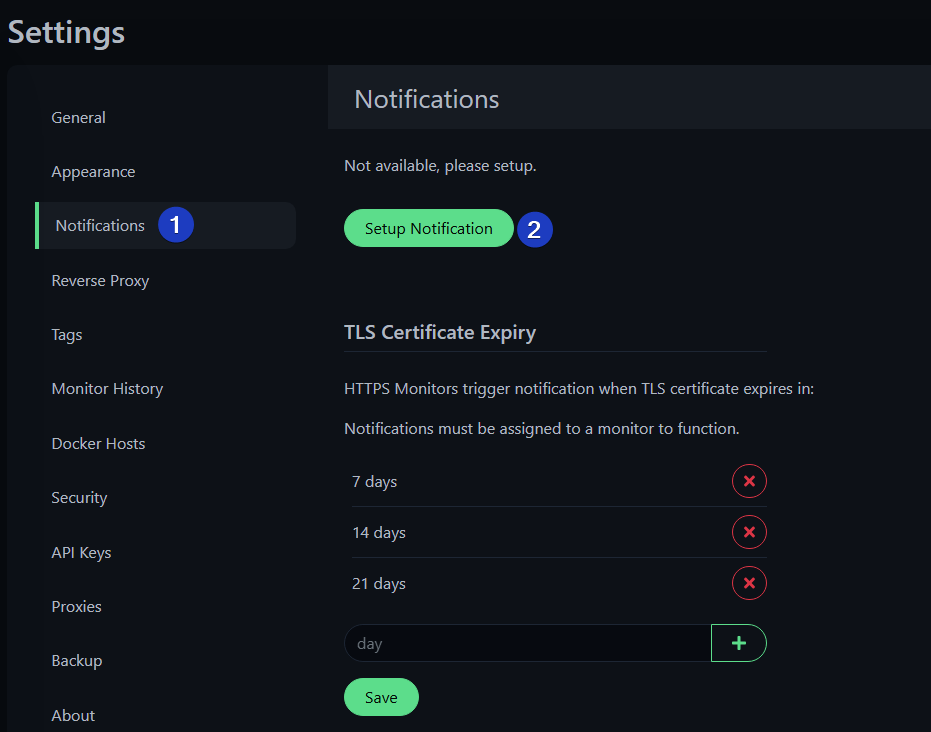
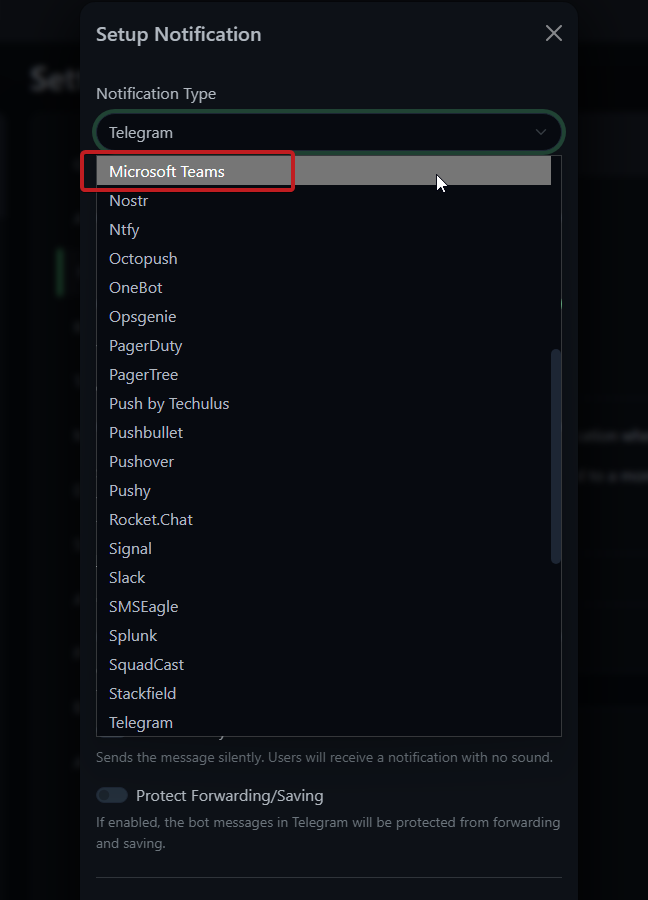
- Add Notification in Uptime Kuma:
- Go to Settings > Notifications > “Add Notification” > Type: Microsoft Teams
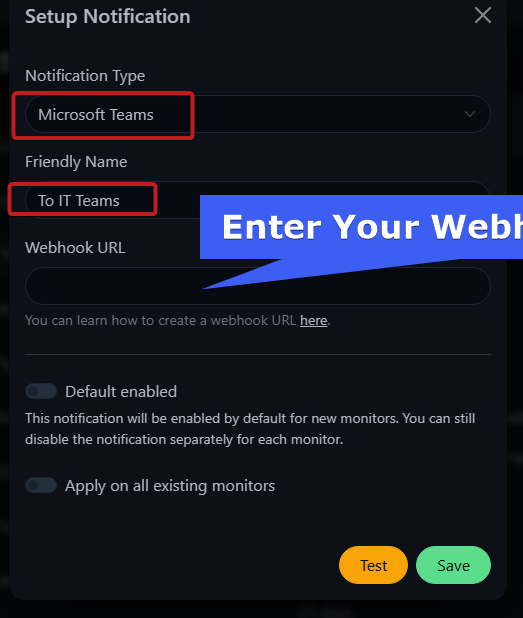
- Settings:
- Name: “To IT Teams”.
- URL: Paste your webhook URL.
- Test and save.
- Assign to Monitors:
- Edit each monitor > Webhooks or Any
- Simulate downtime (e.g., disable a VM’s network) to test alerts.
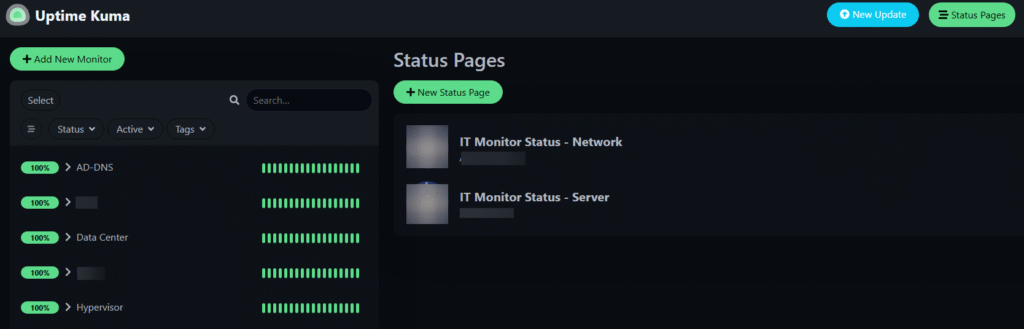
Step 6: Create Status page or Maintenance page
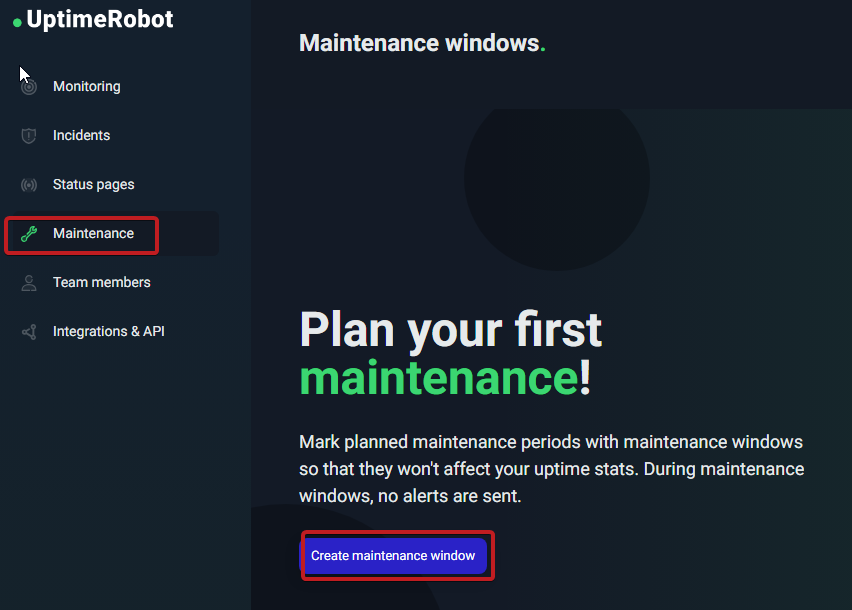
Schedule Maintenance
- Create a Maintenance Window:
- Go to Dashboard > “Maintenance” (left sidebar) > “Add”.
- Settings:
- Title: “Server Maintenance”.
- Description: “Planned downtime for updates.”
- Date Range: Select start/end (e.g., May 28, 2025, 10:00–12:00 Asia/Dubai).
- Time Zone: Asia/Dubai.
- Strategy: Manual (start/stop manually).
- Monitors: Select affected monitors (e.g., internal server).
- Save.
- Status: Start the maintenance window when ready (pauses alerts and marks monitors as “Under Maintenance” on the status page).
Step 7: Updating Uptime Kuma
To update to a new version (e.g., 1.24.x):
cd ~/uptime-kuma
nano docker-compose.yml
Update the image:
image: louislam/uptime-kuma:1.24.x
Pull and restart:
docker-compose pull
docker-compose up -d
Conclusion
Uptime Kuma has transformed the way I monitor my internal network, giving me real-time visibility into server, network, and firewall performance, complete with SLA tracking and instant alerts through Microsoft Teams. By securing the dashboard with SSL and customizing it, the tool feels perfectly aligned with my organization’s needs—and even some of my friends have found it incredibly helpful.
I hope this guide makes your journey into effective monitoring easier and more enjoyable! If you found it useful, please share it with your IT friends and colleagues. Let’s help each other stay ahead of downtime, maintain SLA commitments, and enjoy peace of mind together!
Resources:
- Uptime Kuma GitHub: https://github.com/louislam/uptime-kuma
- Docker Compose: https://docs.docker.com/compose/
- Nginx: https://nginx.org/
Happy Monitoring!
Don’t forget to share this with your IT community and they’ll thank you later!