
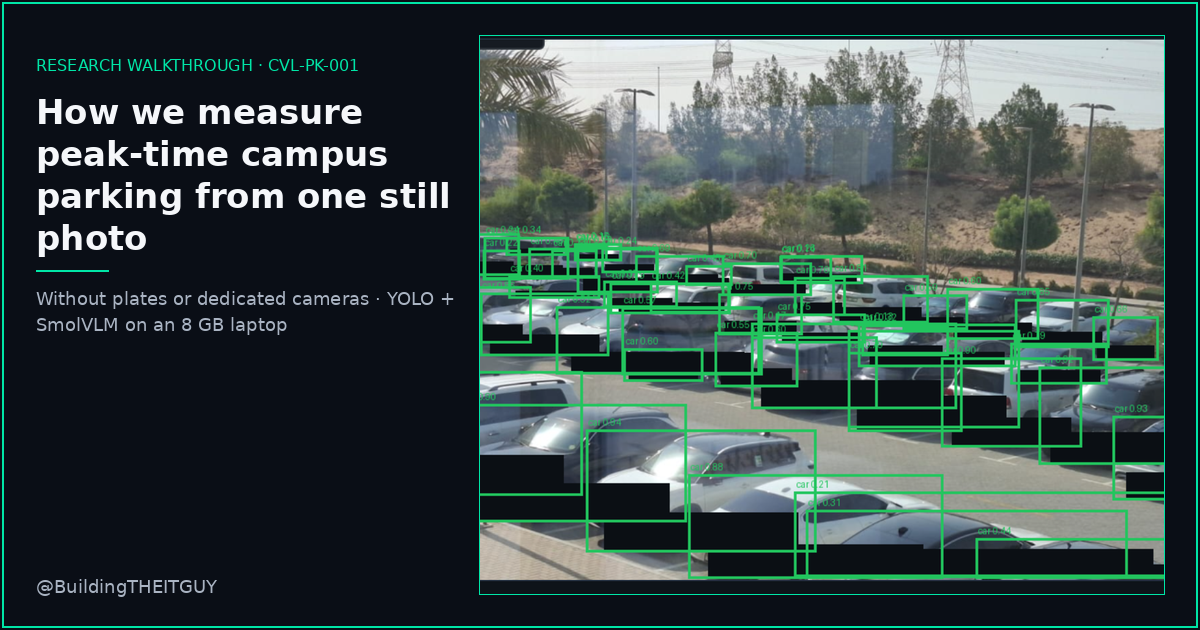
Every morning between 07:30 and 09:00, our campus car parks fill up. You can feel it as a student circling for a bay. But nobody at the University could put a number on it — and buying a licence-plate camera system to find that number would be expensive, invasive, and slow.
So we built the smallest honest version instead: take one photograph of a car park, count the vehicles in it, and divide by how many bays that car park has. That is the whole measurement. It runs on a student laptop with an 8 GB graphics card, it never reads a licence plate, and the full protocol is published so anyone can repeat it.
This post is the walkthrough. I have written it the way a research lab briefs a stakeholder — but explained so that a first-year student who has never touched machine learning can follow every step. Jargon gets unpacked the first time it appears.
The 60-second version
- The question: from one photo, how full is this car park?
- The method: an object detector counts cars; you divide by the number of bays you counted yourself.
- The kit: a gaming laptop (RTX 5070, 8 GB), free open-source models, no cloud bill.
- The guardrail: no plates, no faces, no live cameras, no enforcement. Plate areas are blacked out before anything else reads the image.
- The proof it is real work: Ultralytics, Hugging Face and Voxel51 ship the same building blocks, and three published datasets (PKLot, CNRPark-EXT, ACPDS) study exactly this problem. Links in section 4.
- Try it: Campus Vision Lab on Hugging Face
01How a research walkthrough is structured
Before the technical part, a word on format — because this is the bit students most often get wrong when they write up a project.
A tutorial says “install this, then run that.” A research walkthrough does something different. It defends a number. Read enough engineering write-ups from applied labs — Ultralytics’ solution guides, Hugging Face model cards, NVIDIA’s edge deployment notes — and the same five-part spine appears every time:
-
Name the thing you are measuring
One sentence. If you cannot say what number you are claiming, you do not have an experiment — you have a demo.
-
Show who measured something similar first
Both the people shipping working code and the people who published data. Then say plainly where you differ. Standing on other work is normal; pretending you invented it is not.
-
Publish a protocol somebody else can run
Not “it works on my laptop.” Real steps, real dependency versions, a real download link.
-
Show a figure you are legally and ethically allowed to show
Privacy is an engineering step you build, not a sentence you add to a caption.
-
Report a failure
The tiny detector boxing a shade structure as a “table” is not embarrassing. It is the finding. Hiding it is the actual failure.
Why this matters to you
If you are writing a final-year project, this spine is your marking scheme in disguise. Examiners are looking for a defined measurement, honest positioning against prior work, reproducibility, and known limits. A pretty demo with none of those scores badly.
02The question, in plain English
University of Dubai’s car parks at Academic City tighten sharply during morning arrival and again at class-change time. The tempting project here is “build smart parking for the campus.” That is too big, needs infrastructure we do not have, and raises privacy problems immediately.
So we shrank the question until it fit on one line:
From one photograph I took, how many vehicles are visible, and what fraction is that of the number of bays I assigned to that car park?
Written as arithmetic, this is the entire method:
occupancy_pct = min(100, 100 * vehicle_count / stall_capacity)Worked example — follow the numbers
Say you photograph the student car park at 07:45. The detector finds 7 vehicles. You walked that section yesterday and counted 40 bays, so you type 40.
7 vehicles ÷ 40 bays = 0.175
0.175 × 100        = 17.5
rounded            = 18% occupancy  →  flag: QUIET
Come back at 09:10 and the same car park reads 28 vehicles: 28 ÷ 40 = 70%, which the lab flags as Mixed. Two photos, same place, two times of day — that contrast is the experiment. A single photo tells you almost nothing.
The two things you must understand about this formula
vehicle_countcomes from the model. Specifically, it is the number of boxes the detector drew that were labelled car, truck, bus, or motorcycle. Anything else it spots — a person, a tree, a bench — is thrown away before counting.stall_capacitycomes from you, the human. The model does not know how many bays exist. You count them by walking the lot or reading the posted figure, and you write down which method you used. Get this wrong and your percentage is wrong — and that is a mistake in your method, not a bug in the AI.
The min(100, …) exists because reality is messier than arithmetic: cars park across lines, or you photograph a subsection while typing the whole-lot capacity. We cap the answer at 100% rather than printing an absurd 130%.
The four flags, and what they actually mean
| Occupancy | Flag | What you would tell someone |
|---|---|---|
| Below 40% | Quiet | Plenty of space. Arrival has not started, or you missed the rush. |
| 40–74% | Mixed | Normal working use. Open bays still easy to find. |
| 75–89% | Peak | Few bays left. This is the window the lab exists to study. |
| 90% and above | Stress | Treat as full; overflow elsewhere. Still a teaching flag, not an instruction to Facilities. |
What this project is not
Not a live camera network. Not number-plate recognition. Not face recognition. Not parking enforcement. Not self-driving car research. It is a still-photo measurement for campus operations and teaching, and every design decision below exists to keep it inside that boundary.
03Jargon decoder
Four terms carry almost all the weight in this post. If you already know them, skip ahead. If not, these are the plain versions — open each one.
What is an “object detector”? What is YOLO?
An object detector looks at an image and returns a list of boxes: “there is a car here, a car there, a motorcycle in the corner.” Each box has coordinates, a label, and a confidence score between 0 and 1.
YOLO (“You Only Look Once”) is a well-known family of fast detectors, maintained commercially by Ultralytics. Out of the box it recognises 80 everyday object types from a standard list called COCO — including car, truck, bus and motorcycle. We use it untrained: no custom dataset, no labelling weekend. That is deliberate, so students can see the detector as a component rather than a mystery.
Model sizes are named by letter: n for nano (smallest, fastest, least accurate), then s for small, and upwards. Our published app.py defaults to yolov8n so it starts on almost any machine; the lab protocol moved counting runs to yolov8s at higher resolution once we saw nano missing distant cars.
What is a VLM, and what is SmolVLM doing here?
A vision-language model takes an image plus a text question and answers in words. Ask “is this car park empty, mixed, or packed?” and you get two sentences of description.
We use SmolVLM-500M-Instruct from Hugging Face — deliberately tiny, around 1.2 GB of graphics memory for a single image, which is why it fits alongside YOLO on a student laptop.
Critically, its answer is not the measurement. It is a second opinion. If the detector says 7 cars but the caption says “the lot appears packed”, something is wrong — probably cars hidden behind other cars — and that disagreement goes in your notebook. Using a chatty model’s guess as your occupancy figure would be bad science.
GPU, VRAM, and why “8 GB” keeps appearing
A GPU (graphics card) does the parallel arithmetic these models need. VRAM is the memory on that card, and it is the hard ceiling: if a model does not fit in VRAM, it simply will not load.
Our reference machine is an RTX 5070 laptop with 8 GB. Plenty of published computer-vision work assumes 24 GB data-centre cards. Stating the real envelope is part of being honest — and it is why we chose small models rather than impressive ones.
“Inference”, “occlusion”, “confidence”, “imgsz”
Inference = running a trained model to get an answer (as opposed to training, which is teaching it in the first place). We only ever do inference. We train nothing.
Occlusion = one object hiding another. A car tucked behind a 4×4 may never be counted. This is the single biggest source of error in the whole project.
Confidence threshold = how sure the detector must be before it reports a box. Lower it and you catch faint distant cars but also invent things that are not there. We use 0.12 for counting runs, which is low, because missing real cars distorts occupancy more than the occasional false box.
imgsz = the resolution the image is shrunk to before the model sees it. The default 640 pixels loses small distant cars in a wide car park shot; 1280 keeps them. This single setting changed our results more than any clever idea.
04Who already proved the idea
Counting parked cars from a photo is not a new idea, and I want to be explicit about that. Our contribution is narrow: scoping it to Academic City, to an 8 GB laptop, and to a privacy path that lets us publish the pictures.
Below are the sources we genuinely learned from. I have deliberately led with people shipping working code — companies and open-source maintainers — and then the research datasets underneath them. For a student, this ordering is useful: you can run the first group this afternoon.
Group A — engineers shipping it (you can run these today)
-
Ultralytics — Parking Management solution. The maintainers of YOLO ship a parking feature: you draw polygons over each bay once, saved as JSON, and it reports occupied versus available by testing whether a detected vehicle’s centre falls inside a bay.
Guide · Source code
Learned: occupancy is geometry plus a detector — unglamorous and solid. Differed: we do not require a mapped bay layout on day one. Students type a capacity number instead. That is weaker as facilities software and better as a teaching tool, because the entire calculation stays visible in one line. -
Ultralytics — YOLO on NVIDIA Jetson. Deployment guide
Learned: credible vision work names the hardware it actually runs on, with benchmarks. That is why “RTX 5070, 8 GB, CUDA 12.8” appears in our write-up rather than a vague “we used AI.” -
Hugging Face — SmolVLM. Model card · technical report arXiv:2504.05299
Learned: a 500-million-parameter captioner is small enough to sit beside a detector on one laptop. Also — read their model card — Hugging Face explicitly lists unauthorised surveillance as misuse. We treated that as a design constraint, not a legal footnote. -
Voxel51 — PKLot republished on the Hub. Dataset card
A computer-vision tooling company rehosted the classic parking dataset: 12,416 photos, three car parks, sunny/cloudy/rainy, roughly 695,000 labelled bays. Learned: weather and camera angle are the real test, not one nice sunny frame. We did not train on it — we used it as proof that photo-based occupancy is a properly studied, properly labelled problem. -
Community models and Spaces. parking-lot-yolo26m detects
space-empty/space-occupieddirectly, and its card admits production sites still want mapped bay polygons. drone-parking-occupancy is a live demo from overhead.
Learned: detecting bays is the next lab. Counting vehicles is the first one.
Group B — the published datasets and papers underneath
-
PKLot — Almeida, Oliveira, Silva Jr., Britto Jr. & Koerich, Expert Systems with Applications, 2015. DOI · free PDF
Their classifier scored above 99% when tested on the same camera view it trained on — and fell to about 89% on a car park it had never seen.
Learned: this is the most important lesson in the whole post. A model that has only seen one angle of one campus will look brilliant and then fail on the next site. So our protocol repeats the same UD car park at two different times and requires students to state a limitation, instead of claiming a universal parking AI. -
CNRPark-EXT — Amato, Carrara, Falchi, Gennaro, Meghini & Vairo, Expert Systems with Applications, 2017. DOI · preprint · dataset · code
They ran occupancy detection on the camera itself with a network small enough for embedded hardware, and released ~150,000 labelled bay images covering occlusion, seasons and nine viewpoints.
Learned: “decentralised” means the heavy pixels never leave the device. That directly shaped our architecture — the Hugging Face page is a static document, while the models run on the lab laptop. -
ACPDS — Marek, 2021. arXiv:2107.12207 · MIT-licensed code · applied fork: thebkht/smart-parking-system
Every image from a unique viewpoint, and train/test car parks deliberately kept separate — reaching ~98% on unseen sites by classifying known bay patches rather than counting cars.
Learned: if you already know where the bays are, classify the bay; do not count cars and hope. We do not have Academic City’s bay polygons on day one of a teaching module, so we count vehicles and make capacity an explicit, stated assumption. Mapping bays and comparing the two methods on identical photos is our planned follow-up.
Side by side: what we borrowed, what we refused
| Source | What they measure | What we took | What we refused |
|---|---|---|---|
| Ultralytics Parking Management | Vehicle inside a mapped bay | Detector plus an explicit occupancy readout | Requiring a bay map on day one |
| PKLot / Voxel51 | Bay occupied vs empty, across weather | Photos are enough; weather will break you | Training on their car parks and calling it UD |
| CNRPark-EXT | Bay occupancy computed on-camera | Keep inference local, make the protocol public | A permanent camera network on campus |
| ACPDS + edge forks | Unseen-site bay classification | The obvious next experiment | Pretending a car count equals bay classification |
| SmolVLM-500M | Short description of an image | A two-sentence cross-check | Using a caption as the occupancy figure |
05What we built, and where we differ
Two surfaces, one experiment. The split is the single most useful design decision in the project, and it comes straight from the CNRPark lesson above.
-
A public protocol page (static, free, no compute)
huggingface.co/spaces/BuildingTHEITGUY/Campus-Vision-Lab — the briefing, materials, procedure, ethics rules, report checklist and redacted figures. These are the canonical files. Students clone this; nobody copies a folder path off one lab PC.
-
A local estimator app (where the models actually run)
app.pyon the teaching laptop: pick car park, time window and capacity → upload a photo or use the webcam → detect vehicles → mask plate zones and people → print the occupancy report → optionally caption the already redacted frame.
Why separate them? A free static page can serve the handout to every student on the course, forever, with no GPU bill. Model weights stay on hardware that can actually load them. Publish the protocol; keep the heavy inference controlled.

06The field walkthrough: photo to percentage
This is the part a student actually performs. It takes about twenty minutes per car park, twice in a day.
-
Choose the car park and the time window first
Decide before you leave: morning arrival, class change, lunch, evening departure, or weekend. Writing the plan down first stops you retro-fitting a story to whatever photo you happened to take.
-
Establish capacity, and record how
Walk the lot and count bays, or use the posted figure. Note which — “walked count, 40 bays, north section only” is a methods sentence. “About 40” is not.
-
Photograph so that cars and empty bays are both visible
Elevated positions work: a walkway, a stairwell, an upper-floor window. A phone held at bumper height fails, because the nearest car hides everything behind it. This one choice dominates your error.
-
Run the estimate
Read four things: the count by class, the occupancy percentage, the flag, and the two-sentence scene note.
-
When the count and the caption disagree, record both
Detector says 7, caption says “packed”? Do not pick a winner and move on. Write both down plus your explanation. This is the most valuable line in the notebook.
-
Log the row, then repeat at a second time window
Date and time, car park, window, capacity and method, counts, occupancy %, flag, caption, occlusion notes. Then go back to the same car park later. Peak only means anything as a contrast against quiet.

Failure report from the lab floor
Our first runs used the nano detector at 640 pixels. It missed a pale car parked far from the camera, and confidently boxed a shade structure as a table. We moved counting runs to YOLOv8s at 1280 pixels with a 0.12 confidence threshold and vehicle-class filtering.
Two published findings say the same thing from different directions: PKLot’s accuracy collapse on unseen car parks, and Ultralytics’ own advice to raise resolution for densely packed bays. Resolution and class filters are method choices you must report, not cosmetic settings. Our published app.py still defaults to nano so it starts anywhere — if you use it for real measurements, change the weights and say so.
07Privacy: mask without reading
Here is the problem that stops most campus vision projects from ever being publishable. A photo of a real car park contains number plates, and sometimes people. You cannot put that on the public internet, and you should not want to.
CNRPark’s answer was to keep pixels on the camera. The ACPDS edge fork sends a few hundred bytes of JSON instead of video. We needed a third answer: a still image we are actually allowed to publish. The order of operations is the whole trick.
-
Detect vehicles — and people, for masking only
People are detected purely so they can be removed. They never enter the occupancy count.
-
Black out the lower band of every vehicle box
That band is where plates live. We do not run character recognition. We never produce plate text, so there is no plate text to leak, store, or subpoena. We mask a region, we do not read it.
-
Black out person boxes entirely
-
Draw the vehicle boxes on the redacted frame
-
Only now show the image to the captioning model
SmolVLM sees the redacted frame, never the original. The prompt reinforces it: two sentences on empty, mixed or packed; do not read plates; do not describe faces.
The ethics rules students agree to are equally short: use photos you took yourself of UD car parks; do not import third-party driving datasets; occupancy counts vehicles only; the output is never an enforcement decision.

08Run it yourself
You need Python 3.11 or newer and an NVIDIA GPU. The canonical files are the Hugging Face Space, not a private folder.
# 1. Get the experiment
git clone https://huggingface.co/spaces/BuildingTHEITGUY/Campus-Vision-Lab
cd Campus-Vision-Lab

# 2. Create an isolated environment
python -m venv .venv
source .venv/bin/activate        # macOS / Linux
.venv\Scripts\activate           # Windows

# 3. Install GPU PyTorch FIRST, then everything else
python -m pip install --upgrade pip
python -m pip install torch torchvision --index-url https://download.pytorch.org/whl/cu128
python -m pip install -r requirements.txt

# 4. Confirm the GPU is actually visible
python -c "import torch; print(torch.cuda.is_available())"

# 5. Launch
python -u app.py
Open the address it prints, usually http://127.0.0.1:7860. The first estimate downloads the model weights into that machine’s cache, so it is slower than the rest.
Three things that will go wrong
| Symptom | Cause | Fix |
|---|---|---|
torch.cuda.is_available() prints False | Plain pip install torch pulled the CPU-only build | Reinstall using the cu128 index URL in step 3 |
| Out-of-memory error on first estimate | Both models loaded on a small card | Stay on nano weights, or run the detector without the caption model |
| Distant cars not counted | Default 640-pixel input | Raise imgsz to 1280 and lower confidence to ~0.12 |
Files: the Space · app.py · requirements.txt
What gets marked
Two photos of the same car park at two time windows · the capacity figure and how you obtained it · counts, occupancy %, flag and caption · one limitation that genuinely appeared in your frames · one concrete follow-up change (weights, resolution, camera height, or a smaller counted subsection).
09Limits, and what we test next
Every measurement has an error budget. Stating yours is not weakness; it is the thing that separates research from a demo.
- Occlusion. A car hidden behind a larger vehicle is never counted. Under-counting is our dominant error.
- Capacity is assumed, not observed. The model cannot see empty bays. A wrong denominator is a methods error, not a model error.
- Night and glare. Headlights, wet tarmac and low light all degrade detection. We have not characterised this properly yet.
- Double counting. Overlapping boxes can inflate the count on dense frames.
- The flags are teaching heuristics. Stress is a classroom label, not an instruction to Facilities.
- The caption can sound confident and be wrong. That is why it is never the number.
Planned next tests, in order:
- Map bay polygons for one stable car park, then compare bay-classification occupancy against our vehicle ÷ capacity ratio on identical photographs. This is the direct ACPDS-style comparison.
- Queue length at the entrance gate during morning arrival.
- Prayer-time rush windows.
- Exam-week overflow car parks.
10Freshman FAQ
Do I need to know machine learning to do this lab?
No. You need to install Python packages, take a careful photograph, count bays honestly, and write down what you observed. No training, no maths beyond a division. The learning happens when the model gets it wrong and you have to explain why.
Why not just count the cars by hand? It is one photo.
For one photo, hand-counting is genuinely fine — and you should do it once, as a check on the model. The exercise is not about saving labour on a single frame; it is about learning a repeatable measurement, its failure modes, and how to document it. That skill scales; your patience does not.
Is this surveillance?
No, and the design makes that verifiable rather than merely stated. There is no continuous feed — a human takes a single photo. Plate regions are masked before anything reads the image, and no character recognition runs at all. People are detected only to be blacked out. No identity is computed, stored or matched. Occupancy counts vehicle classes only.
Can I run it without an NVIDIA GPU?
The code falls back to CPU, but expect it to be slow and to feel unpleasant with the caption model enabled. For a class exercise on CPU, run the detector only and skip captioning.
Why are the models so small? Bigger is better, surely?
Bigger is better if it loads. An 8 GB laptop is the hardware our students actually have, so the honest choice is small models plus a clearly stated envelope, rather than impressive models that only run on a card nobody in the room owns. Constraints stated up front are a feature of good engineering write-ups.
Can I reuse this for my own campus or workplace?
Yes — the app code is MIT licensed. Two conditions: use images you have the right to capture, and keep the privacy ordering intact (mask first, then detect, then caption). If you change the weights or resolution, report it. Ultralytics, SmolVLM and PyTorch keep their own licences.
Where this leaves us
You do not need a data-centre GPU to teach real computer vision on a campus. You need four things: one sentence defining the number you claim, a hardware envelope you can defend out loud, a privacy path for the images you intend to publish, and a protocol other people can clone and run.
Ultralytics, Voxel51 and Hugging Face already ship the components. PKLot, CNRPark-EXT and ACPDS already established that the measurement is real — and, more usefully, exactly where it breaks. Campus Vision Lab is that measurement, sized for Academic City and an 8 GB teaching laptop, with the failures left in.
Start here: Campus Vision Lab on Hugging Face. If you run it on your own campus, I would genuinely like to see the two photographs and the limitation you wrote down.
All sources, in one place
- This lab — BuildingTHEITGUY/Campus-Vision-Lab
- Ultralytics — parking management guide · source · Jetson deployment
- Hugging Face — SmolVLM-500M-Instruct · Marafioti et al., arXiv:2504.05299
- Voxel51 — PKLot dataset card
- Community — parking-lot-yolo26m · drone-parking-occupancy
- Almeida et al., 2015 — PKLot paper · PDF
- Amato et al., 2017 — CNRPark-EXT paper · dataset · code
- Marek, 2021 — ACPDS paper · code · applied edge fork
Mohamed Asath · Building THE IT GUY · AI Lab
Experiment ID CVL-PK-001 · MIT licence for our app code · Ultralytics, SmolVLM and PyTorch keep their own licences
Figures are served from the Hugging Face Space. Upload copies to your WordPress Media Library if you want long-term control of the images.